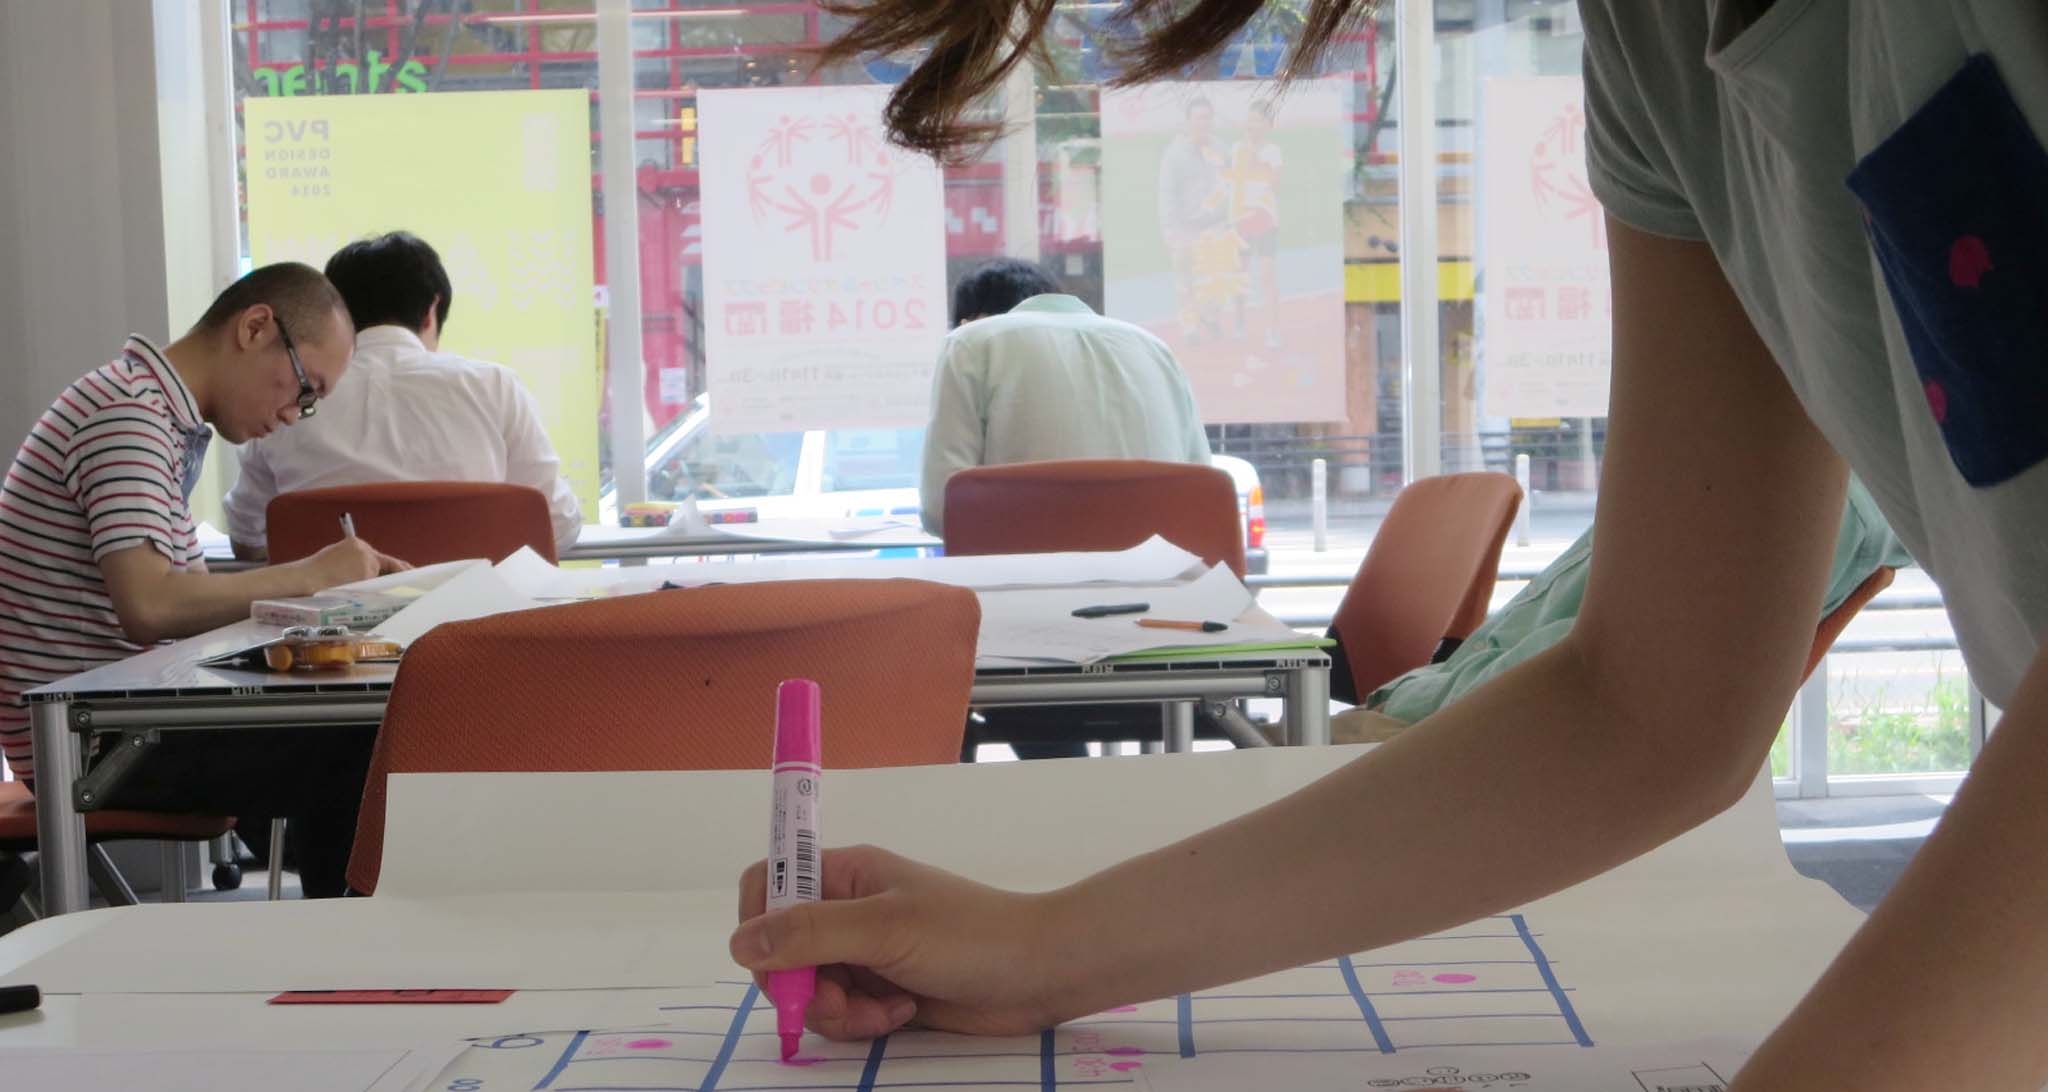
A second co-design workshop was organized as part of Feeler design research with students of Kyushu University Design School. Similarly to previous workshop, organized with the support of professor Yasukuyi Hirai and the Inclusive Design lab members, the session aimed to get the participants’ views and feedback about the use and visualization of Quantified-Self data for improving learning and well-being.
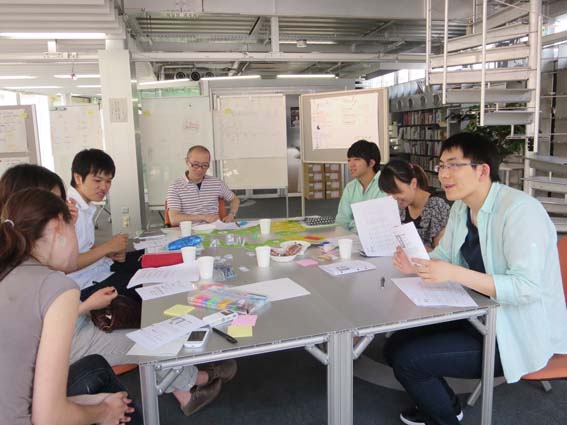
 In this occasion, 6 students from Asian countries (1 from Korea, 2 from China and 3 from Japan) participated in the session designing their own data visualizations and giving feedback about the main issues that the Feeler prototype should approach.
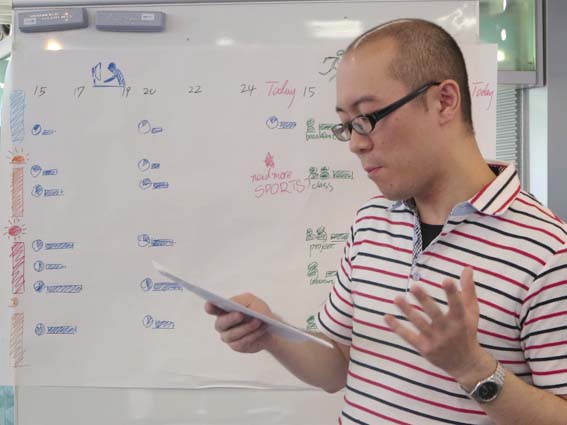
The structure of the session consisted in a general introduction, playing a board game based on self-monitoring practices, designing data visualizations, as well as sharing and assessing the participants’ creations. The workshop schedule was quite intense, it lasted 3 hours during which participants showed a strong engagement.

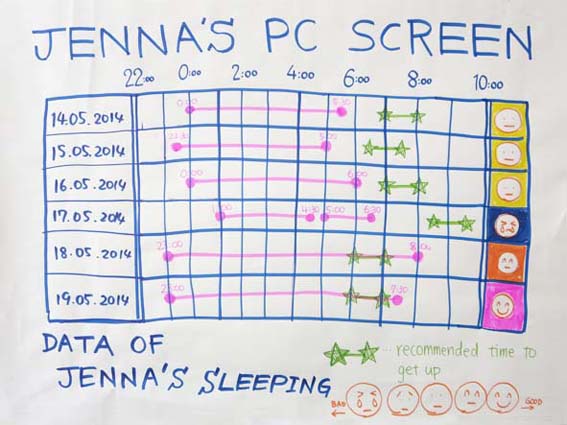
The discussion about the data visualizations helped narrow the design concept and define some implications for the prototype design. In this regard, one of main aspects is the importance that qualitative indicators, such as feelings or mood, have for the users. During the game, when asked to select the type of data that they would like to monitor, all the players picked, in at least one of the areas concerning Sleep, Physical activity and Study activity, “feelings”.

In the case of tools for data monitoring, most of the players decided to use specific wearable devices. However, in a survey distributed after the workshop, participants stated their rejection towards additional devices and expressed their wish for smooth, “invisible” ways of monitoring information. The contradiction between decisions taken during the game and participants’ opinions, make us reconsider the limitations of role-playing as research methodology. Considering the survey answers, in this case we might argue that role-playing limited the range of answers and didn’t allow participants’ free and personal expressions.
In relation to the type of visualization, most of the players decided to visualize their data on screen displays rather than ambient or wearable visualizations. Surprisingly, during the subsequent discussion, participants considered that these other types of data visualizations offered promising solutions and expressed their wish to include them in their design proposals. Quite probably, players made their choices based on their level of familiarity with each of the suggested categories discarding the lesser known options.

During the workshop, one of most interesting discussions dealt with the space and time that participants feel more comfortable to reflect. In other words, when and where do participants reflect about their everyday practices? In this regard, most of the attendants indicated that the time slot they usually allocate to think about their practices is 10-15 minutes in the evening-night. At that time, most of them are at home and their attitude is quite relaxed.
Other interesting issues are related to the role of the user. Most of the attendants didn’t want a system that offers them coaching or recommendations services. In this regard, participants wanted to have an active role and build their own meanings.
Finally, attendants expressed some concerns regarding sharing their personal data. Some of them were not interested at all in connecting self-monitored data with social networks, whereas other participants would like to be able to share their data if they could set some restrictions.